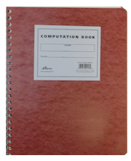
LAB NOTEBOOKS
(These will be checked regularly and will form part of your grade)
You are required to have a lab notebook with numbered pages and to have your experiment details written in it. Be neat and spread out. Allocate at least 20 pages per experiment. Write the following (in pen only) in your lab notebook:
- Description of your experiment.
- Relevant apparatus details.
- Your data or where it is stored. Examples of your signal.
- The procedures that you use to obtain the data.
- The data analysis including the necessary theory and equations directly relevant to the analysis.
- Detailed error analysis including investigations of systematic errors.
For data acquired by a computer, you may paste or staple the tables or plots of data into the notebook. The objective is to have all of the important information written down so that you or someone else can reproduce the experiment and find the essential parameters.
This information will be your primary source for both data and troubleshooting. For this reason it is important that you record as much as possible and erase nothing, use a pen. Too much information is better than too little as you never know where discoveries lay hidden. NEVER tear out a page. Homework in this course is handed in separately. One more reason why you might want to keep a notebook.
PREPARING A REPORT ON YOUR EXPERIMENT
Your laboratory report should be as professional as possible. Style examples are linked on the right. Your report must be your own work, including your own analysis [we will check]. It should be sufficiently explanatory and neat that a colleague of yours, new to this course, should be able to understand your experiment and carry it out based on your report. Do not write your report in lab book or cook book style ("I did this, then I did that"). Rather outline the physics question, the experiment design, your procedure, analysis, results and conclusions. In particular, your report should contain the following sections in addition to a brief, descriptive title, and your name and institution. You are required to use Latex; please use the Latex template linked on the right side. Begin drafting your report as soon as you develop a Plan, but no later than one week after starting the experiment. Your letter grade in the course will reflect how proactive you are. UNETHICAL CONDUCT: PLAGIARISM IS AUTOMATICALLY DETECTED AND WILL BE REPORTED TO THE J-BOARD.
REPORT SCORE BREAKDOWN
-
(5 points) Abstract: A brief summary of the experiment and the key results obtained, including statistical and systematic error estimates.
-
(20 points) Introduction: States the motivation for doing the work and spells out the goal of the work to be performed. Also describes in some detail the theoretical background behind the experiment.
-
(20 points) Experimental setup and procedure: Clearly states why the methods used are adequate for the proposed goal of the experiment, sufficient for another student to understand what you have done.
-
(35 points, 15 points designated to error analysis) Results and Analysis: Displays the processed data that are essential to the goal of the experiment. States briefly how the original data are processed and analyzed before display. Most importantly, makes a comparison of the processed data with the theoretical expectations as outlined in the introduction. Be sure to include error analysis of the data and show error bars on graphs. Don't display the unprocessed raw data--those should be in your lab notebook. All graphs need axes, tick marks, units and fully descriptive captions. See below for available software.
-
(15 points) Discussion: Answer the question: From the results obtained, have you achieved the goal set in the introduction? Explain. Do the results support the understanding of the subject within experimental uncertainties? Again, explain. Suggest possible improved experiments which could result in greater precision.
-
(5 points) Conclusion. Restate your findings, commenting on key points raised in the discussion.
- References: Published journal articles, books, etc. relevant to this experiment, including experimental techniques, electronics, data analysis and statistics. Wikipedia is not an acceptable reference.
Style
Check out Writing Physics Papers for additional information and an example of acceptable report style. Reference all figures in the text, sequentially. Figures with fully descriptive captions may be inserted in the text or placed at the end. It is far better to put them in the text where they are referenced. Mimicking the writing style of the examples in the right hand column may result in a higher grade. The APS style instructions can be found here.
Curve Fitting and Plotting
Software packages are available on the computers in the 122 lab: KaleidaGraph (overly simple analysis, curve fitting) and Igor (more sophisticated analysis and curve fiting with publication quality plots and graphics). You are encouraged to use Python! Python has become the dominant software in science and engineering. Online information regarding data analysis software can be found at the following:
Getting Started with Python
Scientific Computing with Python Tutorial
Jupyter Notebook information
KaleidaGraph Manual
KaleidaGraph Notes
KaleidaGraph Statistics and Fitting
KaleidaGraph Tutorial

